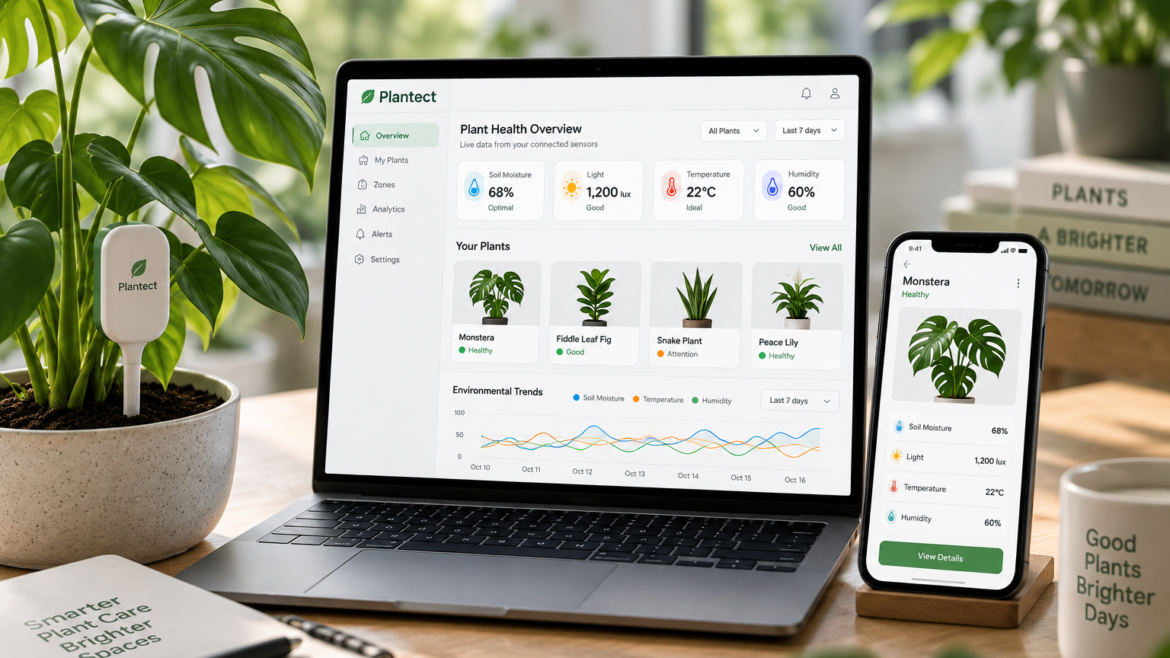
Plantect’s Monitoring Dashboard gives users a clear and organized view of their plant environments by bringing live sensor data into one simple interface. Instead of relying on scattered readings, manual checks, or visual guesswork, users can monitor important conditions such as soil moisture, light exposure, temperature, humidity, and overall plant status from a single connected dashboard. The system is designed to make complex environmental information easy to understand, helping users recognize when a plant, zone, or site may need attention.
For home growers, the dashboard provides a simple way to understand daily plant conditions and make better care decisions. For professional users such as landscapers, greenhouse operators, and municipal teams, it supports multi-zone and multi-site visibility, making it easier to compare conditions, prioritize maintenance, and respond before issues become more serious. With clear visual indicators, status summaries, and plant-specific information, the dashboard becomes the central starting point for smarter, more confident plant care.
Over time, the Monitoring Dashboard will also support historical trends, alert summaries, care activity records, and performance insights. This allows users to move beyond one-time readings and understand how conditions are changing across days, weeks, and seasons. By turning sensor data into practical visibility, Plantect helps users manage plants with more clarity, consistency, and control.